1. UI design
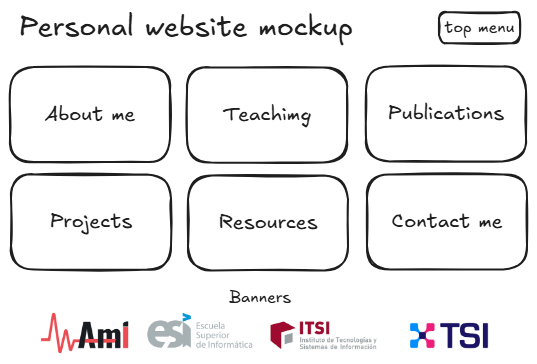
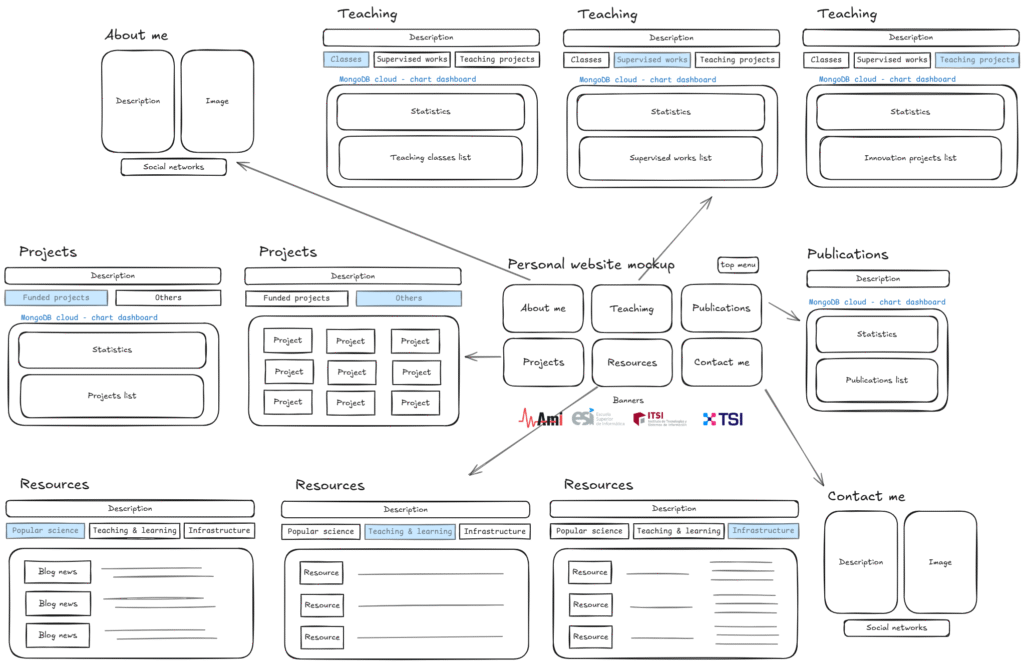
The design guide brings together an overall visual scheme and page-by-page mockups for key sections: Home, About/Contact, Teaching, Projects, Publications, and Resources, enabling alignment between content and UI prior to implementation
Overview mockup
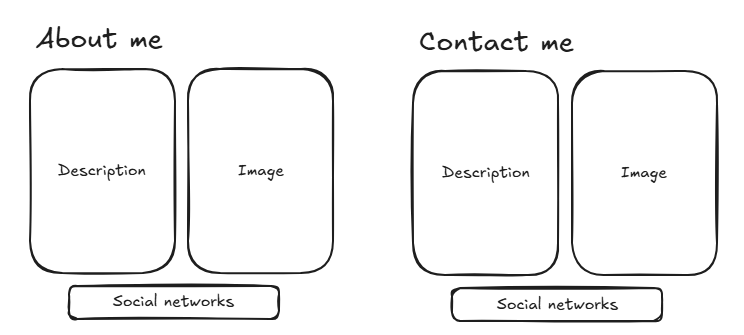
About me & Contact me
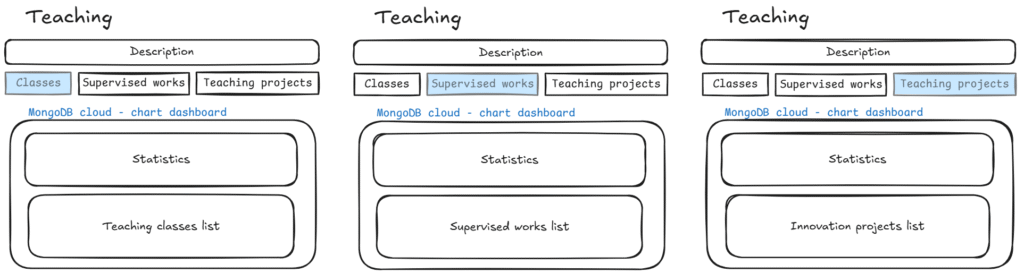
Teaching
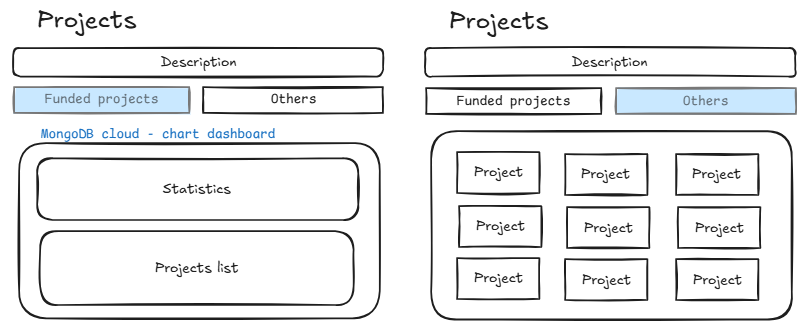
Projects
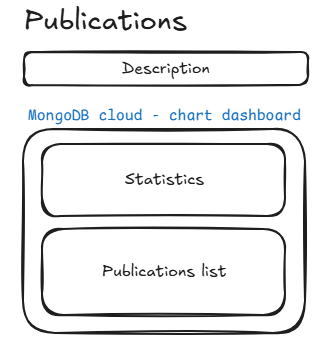
Publications
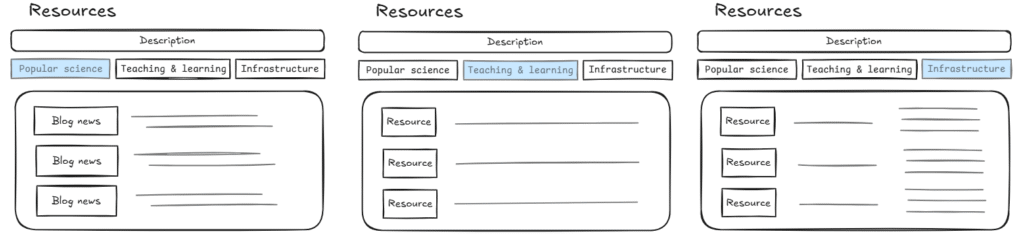
Resources
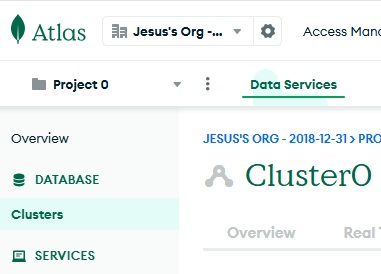
2. MongoDB Cluster
Data persistence is organized into MongoDB collections using cloud services for taught classes, teaching innovation, publications, and projects, with the field schema defined for each, facilitating consumption by the frontend and APIs. All these schemes are shown below.
3. MongoDB Charts
From data persistence in Mongodb cluster, a set of dashboards with multiple charts have been created. It presents relevant statistics about the following groups form the CV: teaching classes, publications, teching projects, final works supervised, and research projects. All the charts are gathered from cluster-views generated and powered by MongoDB Charts engine.
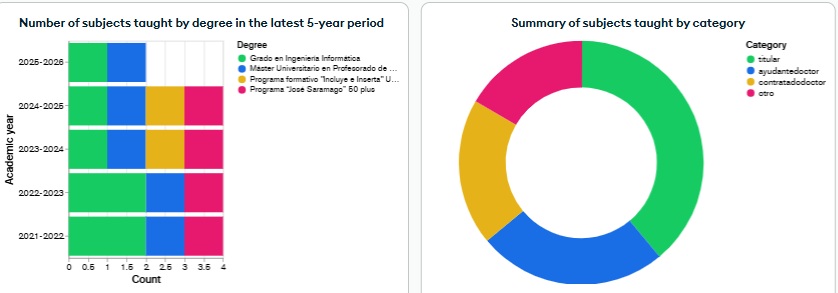
Teaching classes
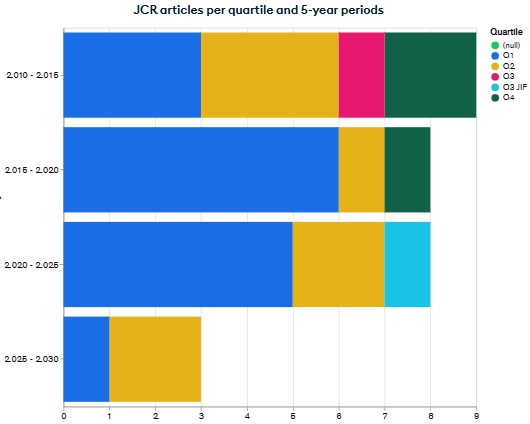
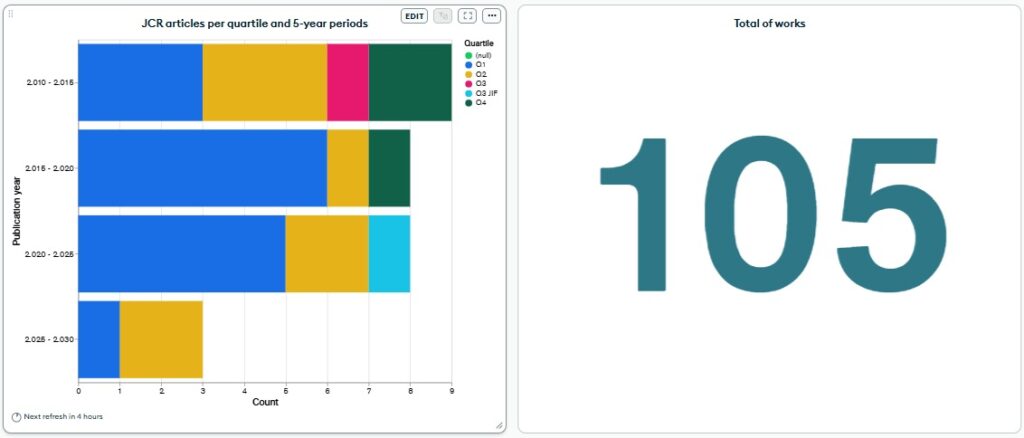
Publications
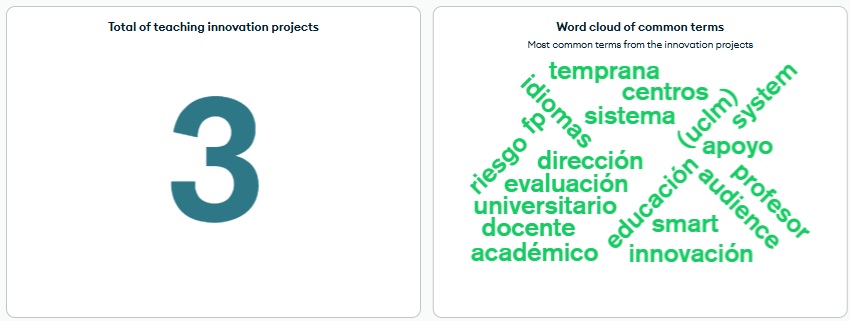
Teaching projects
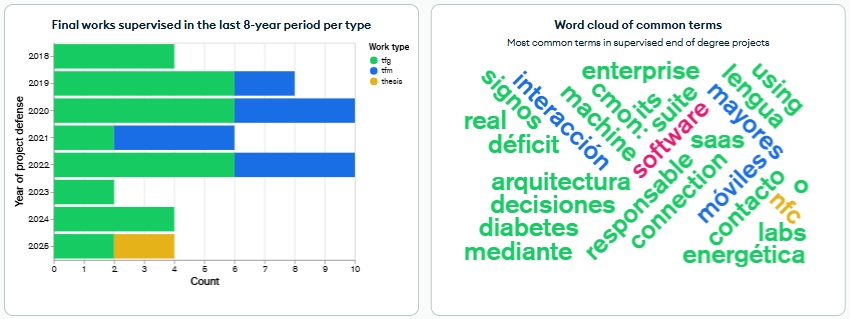
Supervised final works
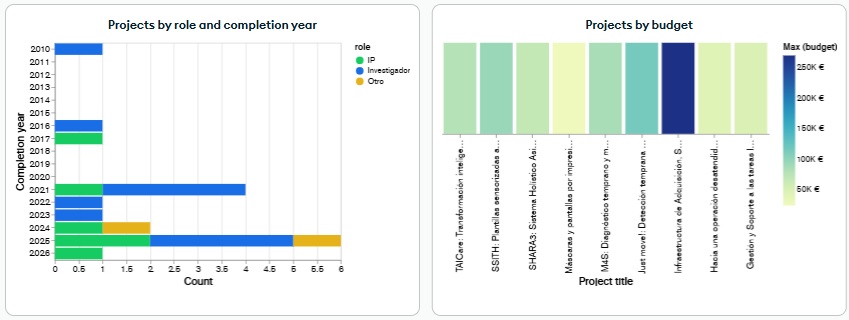
Research projects

4. Results
Once all have been designed and structured, WordPress CMS has been used to integrate content, links and embeded charts. In this way, with some plugins and the minimalio template, this website is published. Blog post and some content keep static, while all stuff dependent on our MongoDB cluster can be automated and charts generated in real time thank to MongoDB charts engine.
You can visualize the results of this making of in the own website. If you have any question about it, contact the author.